Through this survey, we discovered that Tenny Co. has been actively developing the Internet channel over the past few years as the physical channel has been not so efficient. This research is about how young people react to the use of pens , aiming to provide some insights into the marketing decisions for Tenny Co. and the relevant manufacturers.
Analysis
This research takes high school students in Kaohsiung as the objects, and uses the convenience sampling in January, 2013. We sent out the 220 questionnaires to those who took part in the writing contest in Kaohsiung Commerce High School, and other students in Kaohsiung. In the end, we got back 178 completed questionnaires and the return rate is 80.9%. Excluding 36 invalid questionnaires, we got 142 valid questionnaires and the return rate 79.8%. With the Microsoft Excel system, we adopted the descriptive statistic method to deal with the analyses of the 142 valid questionnaires on the sample structure, the source of used pens, the attitudes towards using pens and the wlillingness to buy pens.
The Analyses of Sample Structure
1. Gender
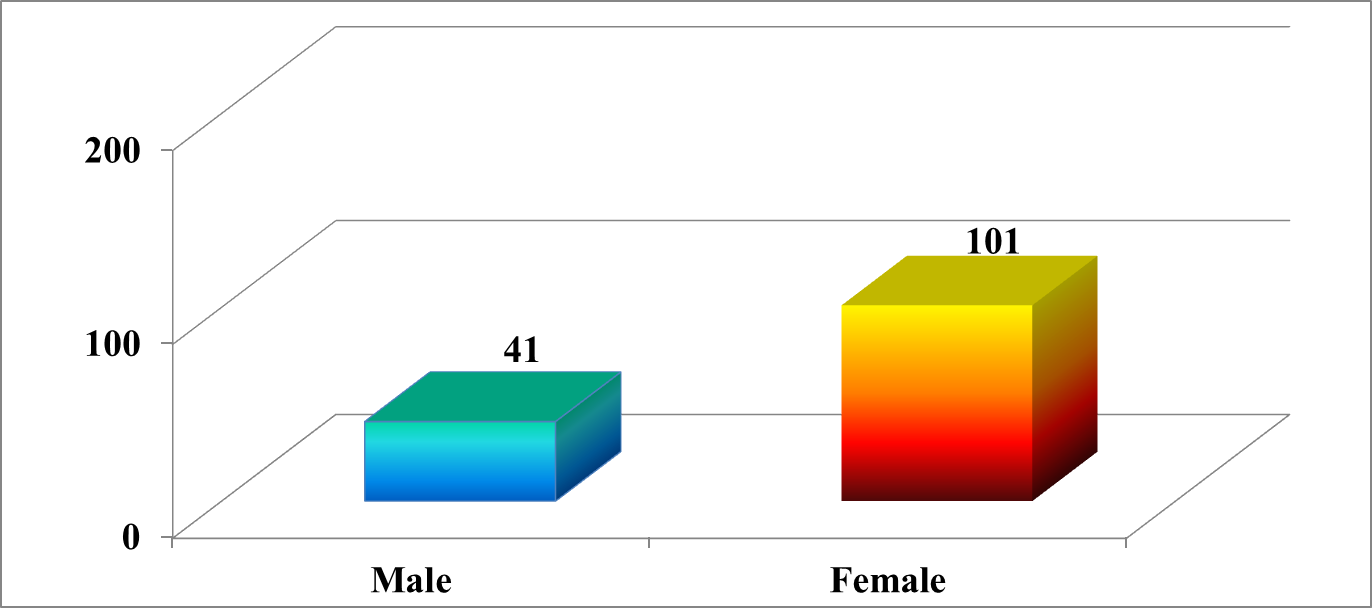
Picture 1-6-1 Gender |
| In terms of gender, there are 101 females and 41 males. Females accounts for 71.1% of all samples. (Picture 1-6-1) |
|
2. Pen owning
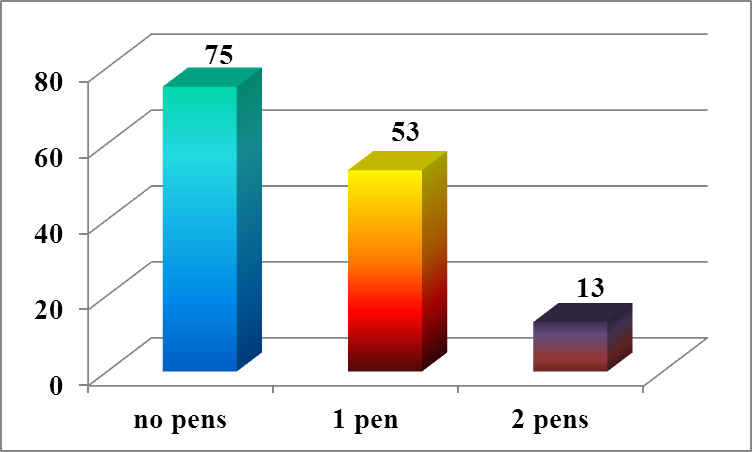
Picture 1-6-2 Pen owning |
| 75 participants have no pens, which accounts for 53.2% of all samples. 53 have 1 pen and 13 have 2 pens. Totally, 66 participants have pens, which accounts for 46.8% of all samples. We could know over half of the participants have no pens. |
|
Empirical Analysis
1. The Source of Pens
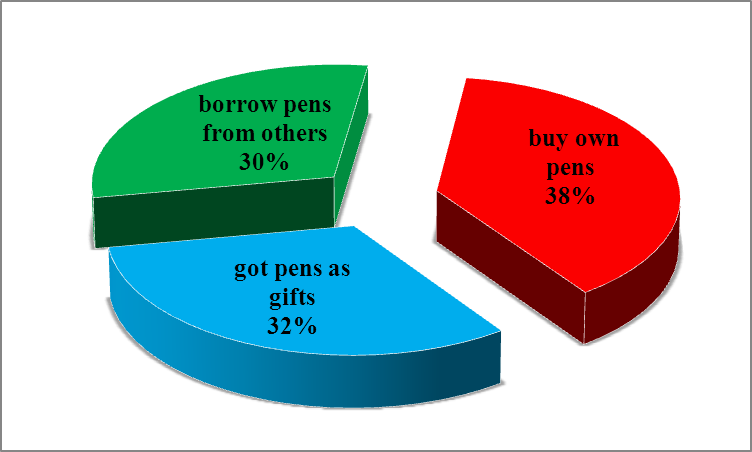
Picture 1-6-3 The Source of Pens |
| In terms of the source of pens, 32 participants borrow pens from others, which accounts for 30% of all samples. 39 buy their own pens, which is 38% of all samples. 35 got their pens as gifts, which is 32 % of all samples. (Picture 1-6-3) We could know a minority of students buy their own pens. |
|
2. The Habits of Using Pens
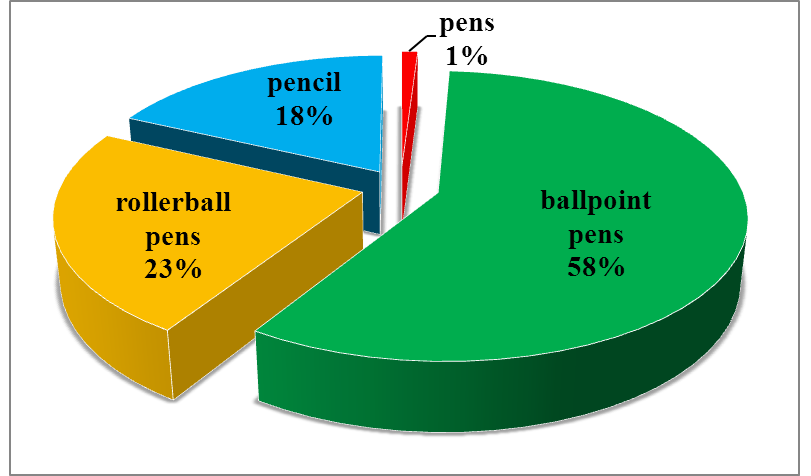
Picture 1-6-4 Analysis of pens using |
| The rate of high school students using pens is rather low, only 1% of all samples. The most used ballpoint pens accounts for 58% of all samples followed by the rollerball pens , 23%. (Picture 1-6-4) This shows the reason high school students use pens is not for learning. |
|
3. The Analysis of the experience in purchasing pens and motivation
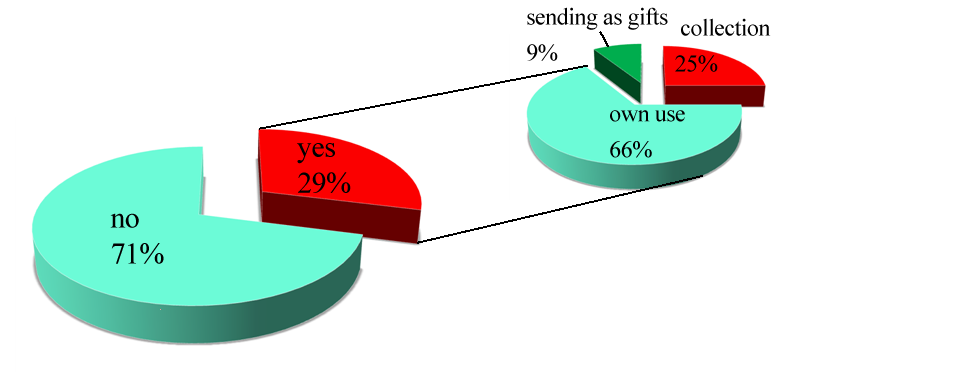
Picture 1-6-5 Experience in buying pens |
| 40 participants have the experience in purchasing pens, 29% of all samples. 97 have no experience, 71%. 25% of the participants buy pens for collection, 66% for their own use, and 9% for sending as gifts. (Picture 1-6-5) |
|
4. The Factors of Influencing Pen Using
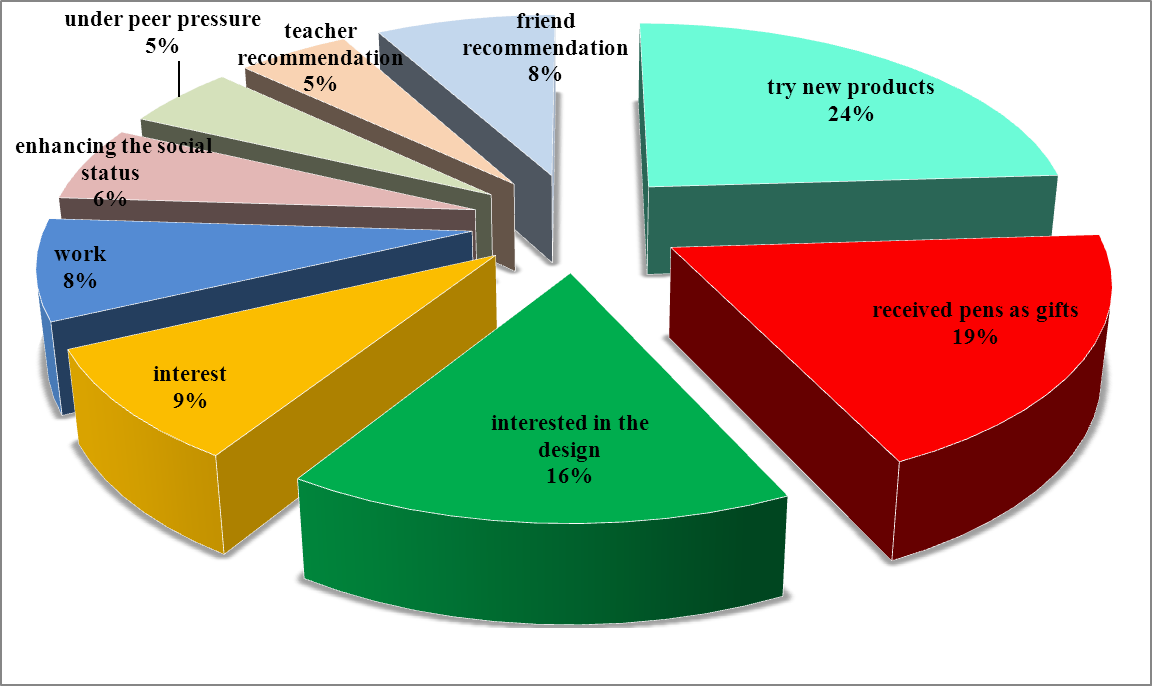
Picture 1-6-6 Factors of Influencing Pen Using |
| Interms of the factors of influencing pen using, 24% of all samples would like to try new products; 19% of all samples received pens as gifts; 16% are interested in the design; 9% are out of interest; 8% are for work; 6% are for enhancing the social status; 5% are under peer pressure. (Picture 1-6-6) From this, we can know tring new things is the main factor for young people to use the pens. |
|
5. The Purposes of Pen Using
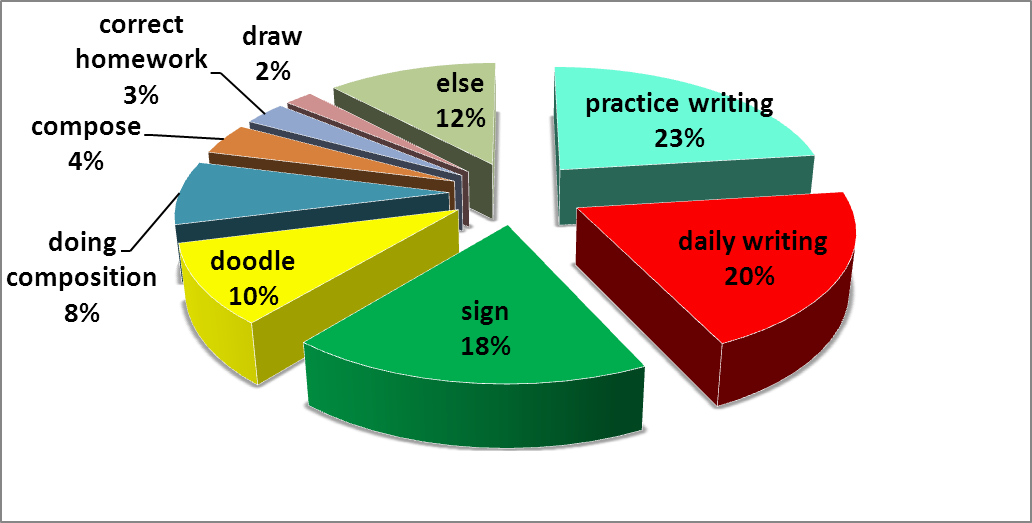
Picture 1-6-7 The Purposes of Pen Using |
| In terms of the purpose of pen using, 23% use pens to practice writing; 20% use for daily writing; 18% use to sign; Other purposes: 10% use to doodle; 8% doing composition; 4% compose; 3% correct homework; 2% draw. (Picture 1-6-7) We can know more young people use pens to practice writing. |
|
6.Channels for buying pens
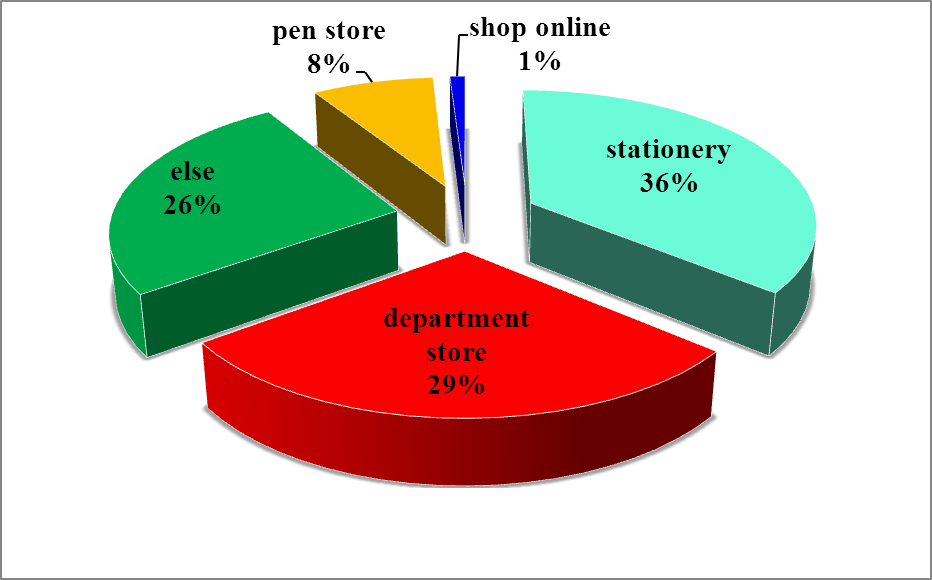
Picture 1-6-8 Channels for buying pens |
| In terms of pen buying channel, 36% are stationery; 29% are department store; 26% are others; 8% are pen store; only 1% shop online. (Picture 1-6-8) We can infer that only a minority of young people would buy pens online, which is an important factor for those manufacturers to think about. |
|
7. Ways to get pen information
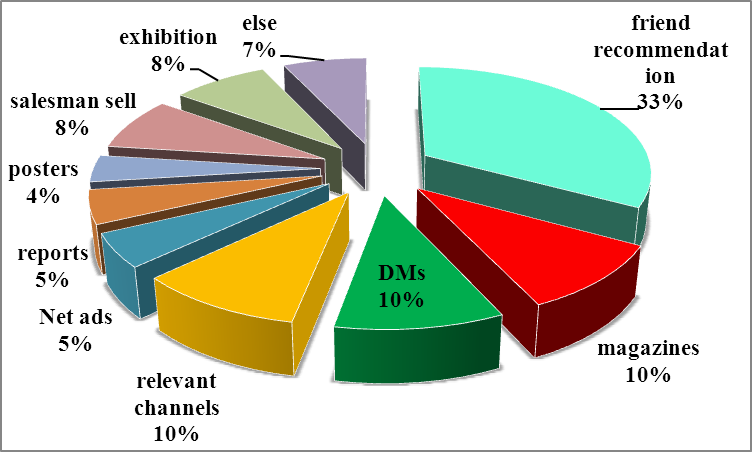
Picture 1-6-9 Ways to get pen information |
| 33% of all samples get their pen information from others’ recommendation; 10% are from magazines, DMs, and relevant channels; 5% are from the Net ads and reports; 4% are from the posters. (Picture 1-6-9)Only a few young people get their pen information from the Net. |
|
8. Preference for Pens
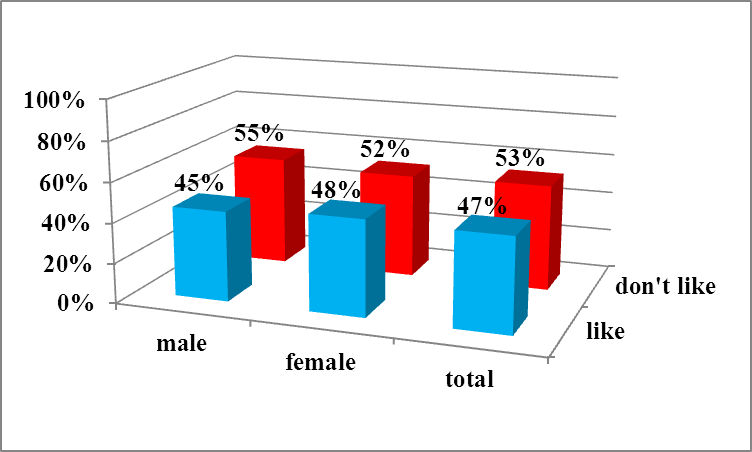
Picture 1-6-10 Preference for Pens
|
47% of all samples like pens while 53% don’t like them. In terms of gender, most male and female students don’t like using pens.
|
|
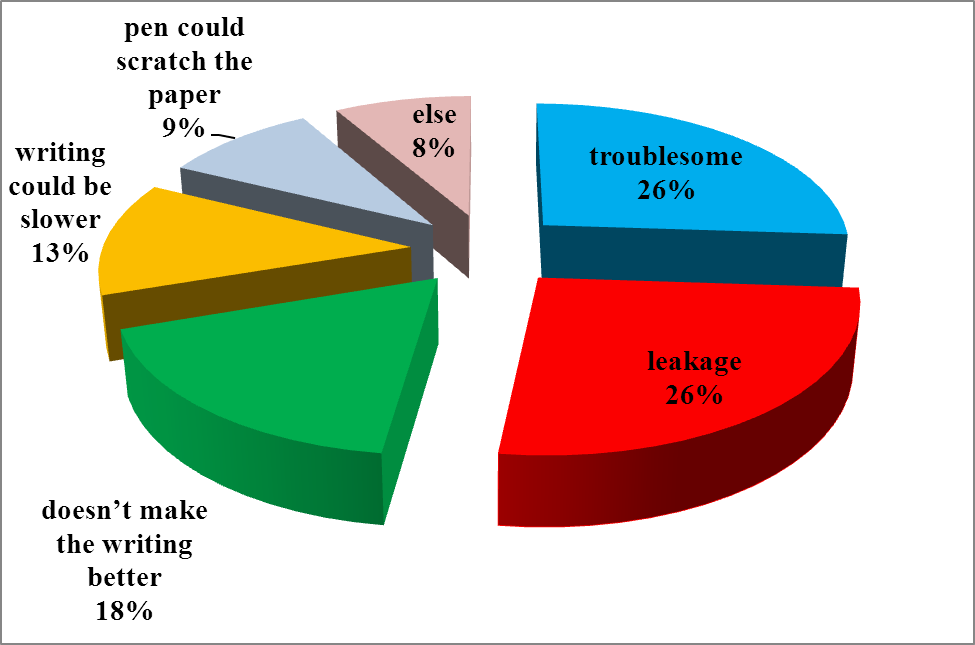
Picture 1-6-11 The factors for disking pens |
| 25% of all samples think it is troublsome to use pens because of the leakage and refill. 18% think it doesn’t make the writing better. 12% think the writing could be slower with the pen. 9% think the pen could scratch the paper. 8% are for other factors. (Picture 1-6-11) We suggest the manufacturers improve the design to make it easy to refill the pens. |
|
9. Analysis for the perceptual factors of pen buying
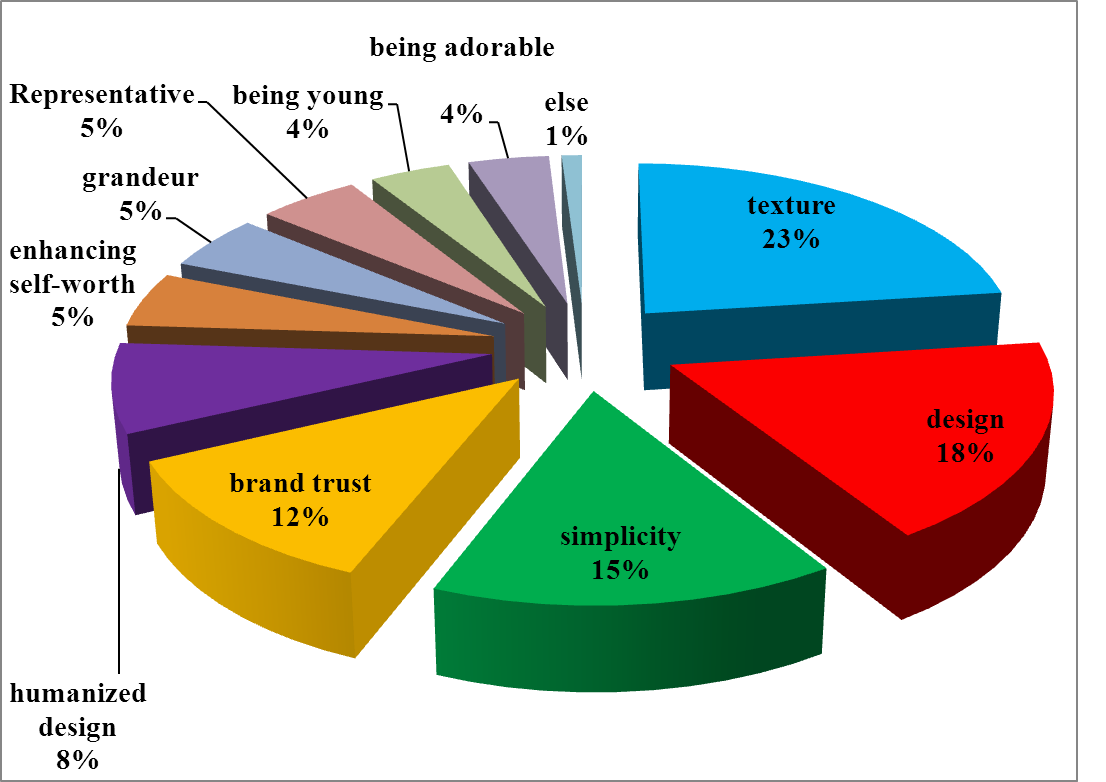
Picture 1-6-12 Analysis for the perceptual factors of pen buying |
| When buying pens people consider 4 major points, which are texture(23%), design(18%), simplicity(15%) and brand trust(12%). Besides, 18%of all samples take the humanized design into consideration; 5% consider enhancing self-worth; 4% for being young, modern and adorable. (Picture 1-6-12). From this point, we can infer that 23% of consumers pay more attention to the texture than brand trust (12%). |
|
10. Analysis for the sensible factors of pen buying
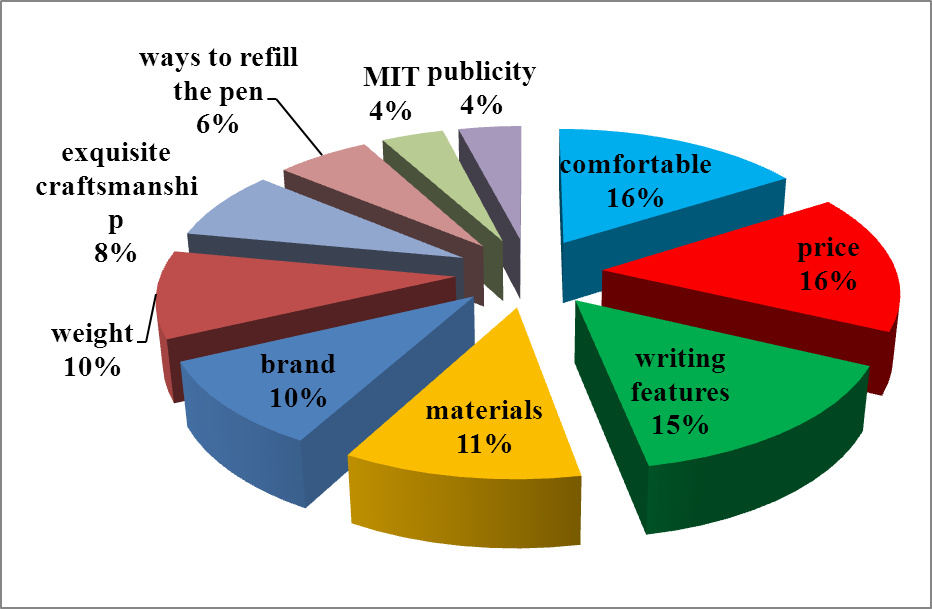
Picture 1-6-13 Analysis for the sensible factors of pen buying |
| Being comfortable(16%), price(16%) and the writing features(15%) are the first 3 factors. Besides, consumers consider the following factors, too, which are materials (11%), brand and weight (10%), exquisite craftsmanship(8%), ways to refill the pen (6%) and MIT/publicity (4%). (Picture 1-6-13) We can infer that the price, being comfortable to hold and writing features are 3 main factors for consumers to consider. |
|
11. Analysis for the Willingness of Pen Buying
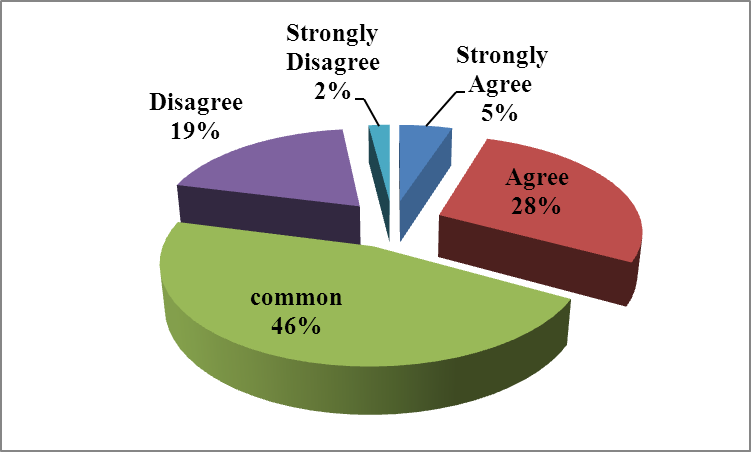
Picture 1-6-14 Analysis for the Willingness of Pen Buying |
| In a whole, 32% of all samples are willing to purchase pens at a higher price. 5% show strong willingness; 21% show no willingness; 2% show strong unwillingness to purchase pens. However, 46% of all samples have no comments. (Picture 1-6-14) We can know one third of young students would show their willingness to buy more expensive pens when they can afford it. |
|
12. Analysis for the willingness to recommend pens
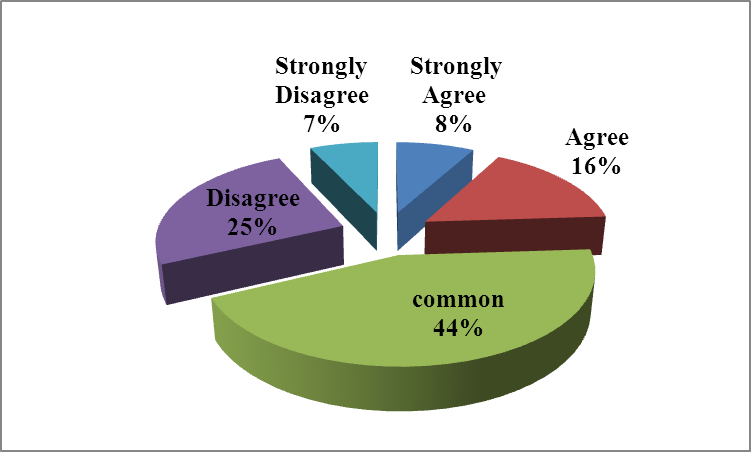
Picture 1-6-15 Analysis for the willingness to recommend pens |
| 24% of all samples are willing to recommend pens to others. Among them, 8% show the strong willingness. 32% show no willingness to recommend, and among them, 7% show strong unwillingness. Besides, 44% have no comments. (Picture 1-6-15) We can infer that most high school students have no high brand loyalty. We suggest manufacturers focus on how to build up young people’s brand loyalty. |
|